Marketing Analytics
What is Marketing Analytics?
The Marketing Analytics module provides analytics data on how your site is performing based on several metrics and dimensions that allow you to better understand your site’s performance from both a quantitative (numbers) and qualitative (user engagement) perspective.
If you have prior experience with using Google Analytics, some of the terms and metrics you’ll find here may be familiar to you.
What’s Included?
There are several categories and topics in the Marketing Analytics module that will provide different types of insights on how your site is performing. Here are the most commonly used ones and what you will find to be the most helpful:
- Analytics Overview: A high-level summary of your site’s performance during a certain time period.
- Live analytics: A dynamic visualization of what’s happening right now on your website.
- Visitors: General information about who visited your site and how they reached it.
- Content: How your pages performed (i.e. page views, load time, navigation depth).
- Entries & exits: The pages your visitors landed on when visiting your site, those that they left from, and links they clicked on while visiting those pages.
- Traffic sources: Where your visitors came from (i.e. search engines, referrers, social media, etc.)
- Behavior: Behavior maps, funnels, user journeys, and other metrics that provide information on how users interacted with pages and elements on those pages within your site.
- Campaigns: A campaign is a marketing initiative that uses UTM links (URLs tagged with special parameters) to track where visitor traffic is coming from (e.g. traffic from social media vs. email or traffic from Facebook vs. Instagram). Campaigns are not currently offered as part of Siteimprove training. If you would like to learn more and/or use campaigns, please reach out and we’ll help you get started.
- Event Tracking: With event tracking, you are able to add tracking to individual elements on a page, so that when users interact with them, that interaction is recorded. Event tracking is not currently offered as part of Siteimprove training. If you would like to learn more and/or use event tracking, please reach out and we’ll help you get started.
Getting Started
There are two ways we recommend you access your site’s analytics data, depending on how often you plan to view it.
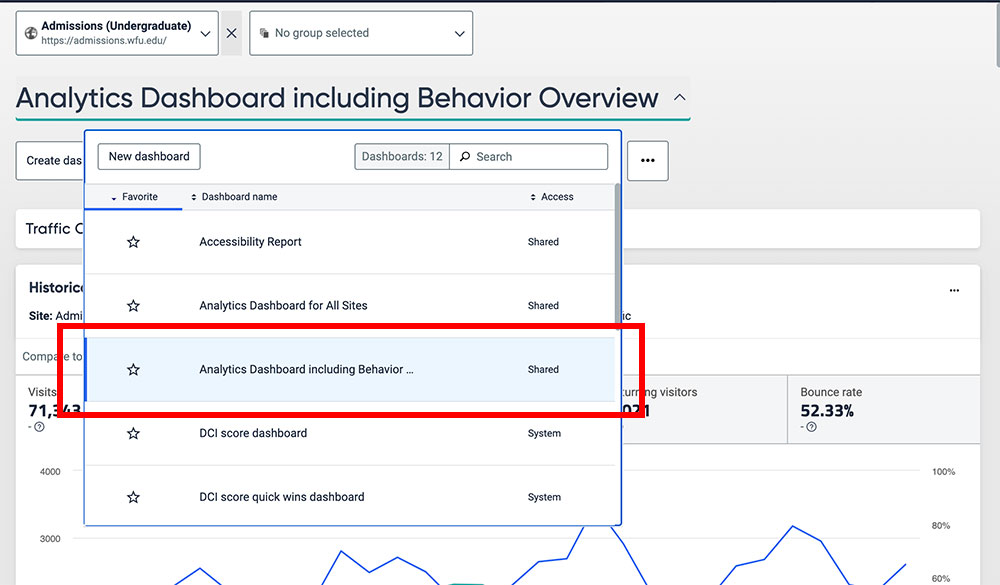
- If the analytics module is your go-to place in Siteimprove and you prefer to have it be the default dashboard when you log in, select Analytics Dashboard including Behavior Overview from the dropdown:
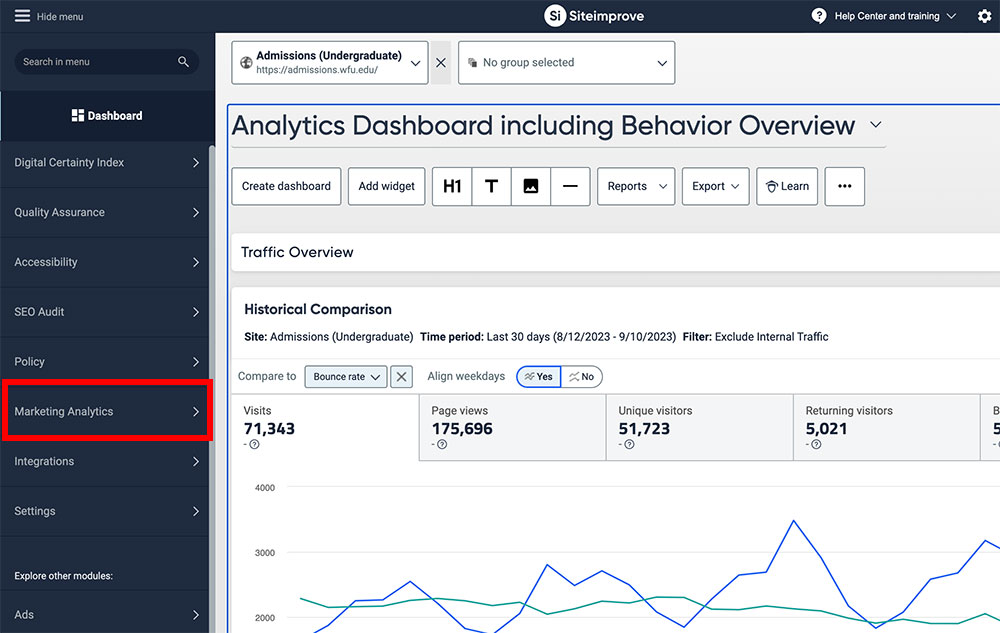
- If you want to have a different dashboard loaded each time you log into Siteimprove, click on the Marketing Analytics module on the left sidebar to access the analytics module:
Your default dashboard can be changed at any point, but you’ll find it easier if you set your dashboard to what you will find yourself using the most.*
* It is recommended that the Editor dashboard (QA) is your default dashboard when you log in if you will be spending most of your time in Siteimprove addressing quality assurance issues.
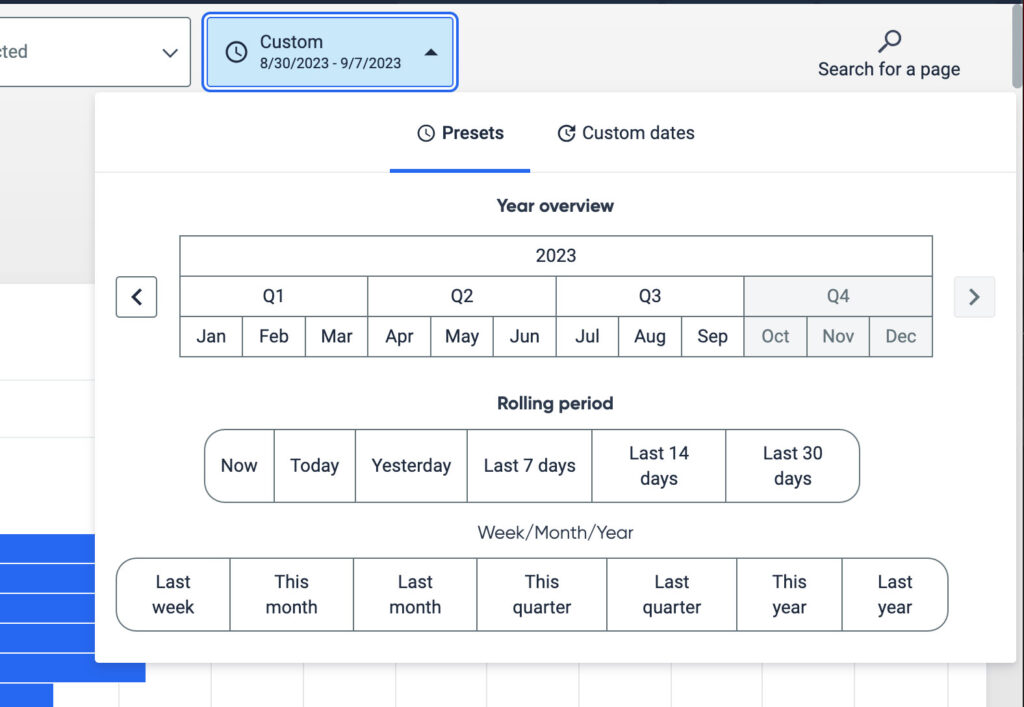
Selecting a Date Range
To view data from your site during a certain time, you can select a preset date range or you can set your own custom date. Click on the date dropdown at the top of the screen:
Note: Data will only go as far back to when your site first started using the analytics module in Siteimprove. If you are looking for data that was collected prior to your site being added to Siteimprove, CER will be able to pull data for you from Google Analytics. Use the web request form to submit your request.
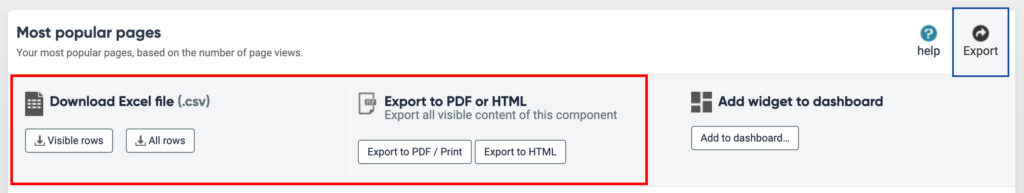
Exporting Data
You can export analytics data from any category in the Marketing Analytics dashboard in different ways.
- Make sure you’re on the category or topic page within the Marketing Analytics module that you want to export data for.
- Select a date range you want to export data for. You can use a preset range or create a custom one.
- Click the Export button located underneath and to the far right of the category or topic page you’re on.
- You’ll be presented with a few different options on what you’d like to export: